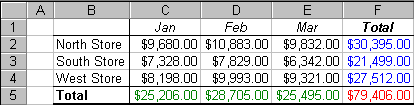
 The image
above shows the data used to create the chart to the left. As you can see
from the image, the most common parts of a chart are:
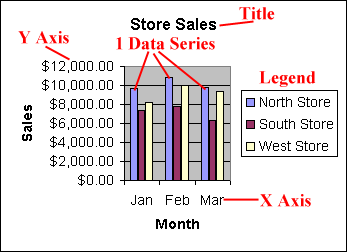
The image
above shows the data used to create the chart to the left. As you can see
from the image, the most common parts of a chart are:
- Title
- X-Axis and title
- Y-Axis and title
- Legend
- Series Data (Note: North Store is one series, South Store is another series, etc.)
The chart to the left has three categories: January, February, and March.